JAMES Henry states that that he is unable to calculate the number of stoppages boaters had to suffer last year (The old system was best).
However, it is not only the number of stoppages that boaters have to suffer but also the length of those stoppages. The number of days lost to navigational closures is, perhaps, a better measure and has been used by CaRT in the past. Allan Richards interrogates CaRT’s stoppage database to produce some figures.
Days lost
The number of days lost to navigational closures in 2020 (i.e. 1/1/2020 to 31/12/2020) was 7803 days. This is slightly up on the 2019 figure of 7772 days lost.
Looked at another way, on an average day during 2019 and 2020, CaRT’s waterways were closed in 21 places.
Winter works
Unfortunately, changes made to CaRT’s stoppage database a couple of years back mean that it is now impossible to differentiate between planned closures (such as winter works) and unplanned closures (such as infrastructure failure).
However, most planned closures take place in the five months between November and March inclusive. Taking the seven months April to October in both 2019 and 2020 an average day would see CaRT’s navigations closed in eight or nine places.
Beyond our control
For many years, CaRT produced annual figures for days lost to unplanned closures together with targets (based on its financial year April to March rather than calendar year). However, by excluding stoppages claimed to be 'beyond CaRT's control', the Trust massively under-reported the number of 'days lost'. For example, in 2017/18 it under reported unplanned closures by 80% (see bottom line on table).
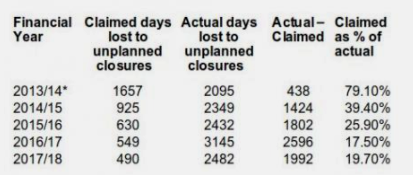 Increasing under-reporting year on year allowed the Trust to claim that it was reducing 'days lost' when the reverse was true. Despite this, CaRT still missed its ‘unplanned days lost’ target five years
Perhaps little wonder it abandoned this particular Key Performance Indicator (KPI) two years ago without explanation...